
Most people don’t actually read their electricity bill.
They look at the total, feel the impact, and move on.
R3,000.
R4,500.
R6,000.
It feels unpredictable. Like something outside of your control.
But your bill is not random. It is structured. And once you understand that structure, you start to see where your money is really going and where decisions can be made.
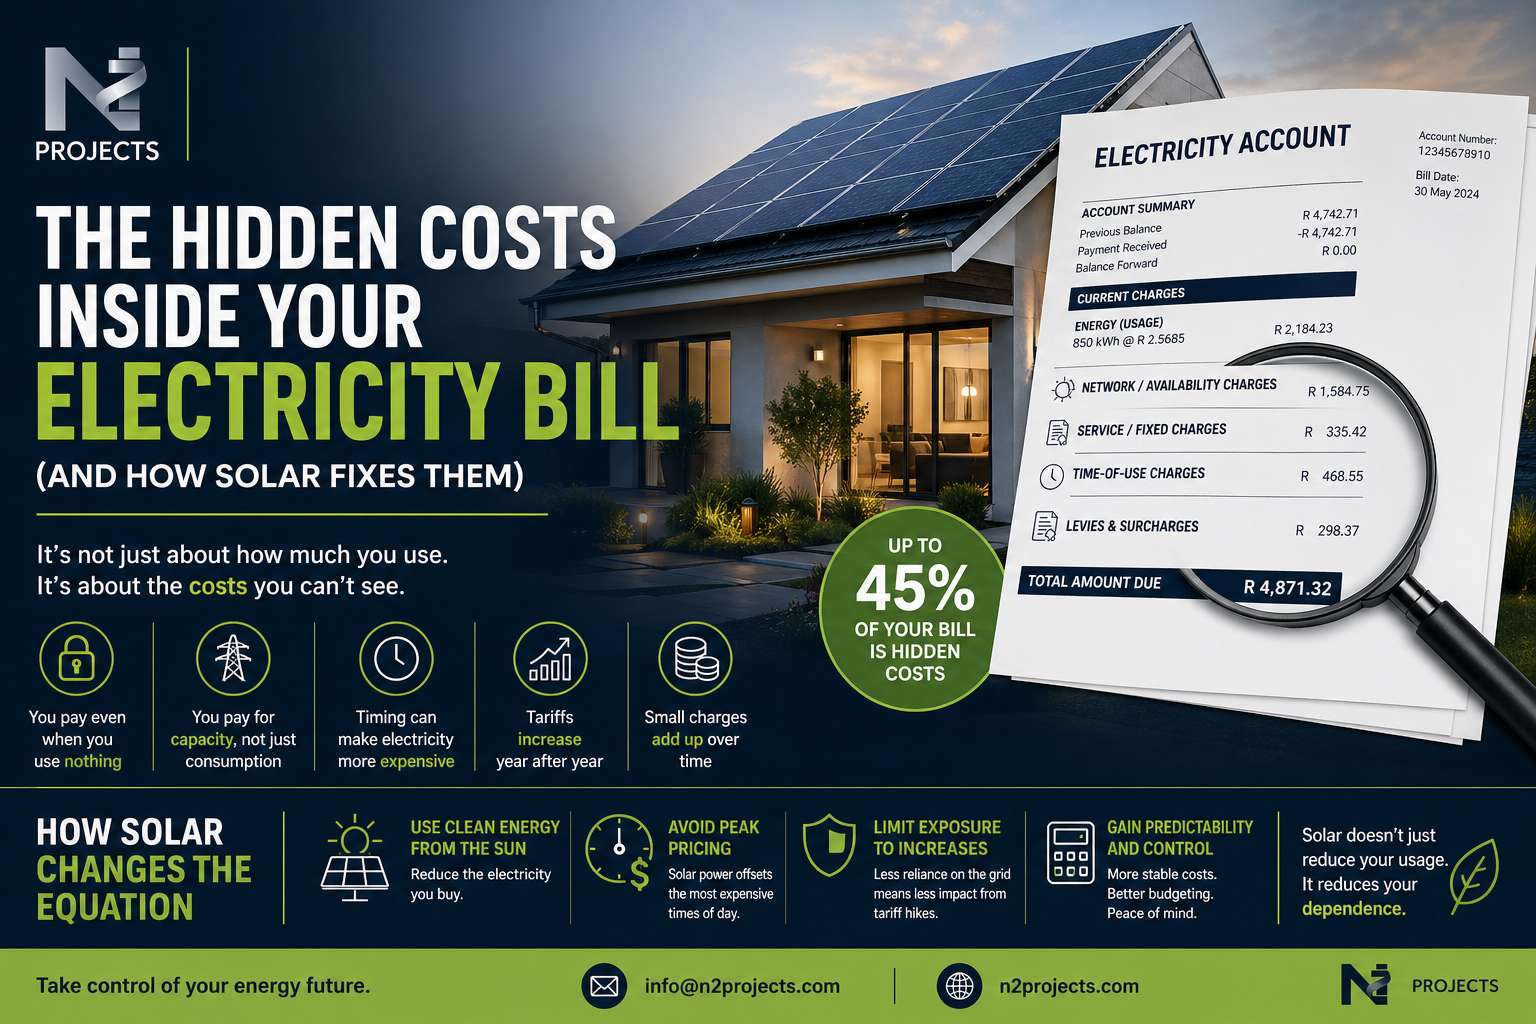
1. Start With What You Think You’re Paying For
Energy Consumption (kWh Used)
This is the electricity you actually used in your home.
- Lights
- Appliances
- Geysers
- Heating and cooling
This line is usually labelled:
- “Energy Charge”
- “Consumption”
- “kWh Used”
What most people believe:
This is the bill.
Reality:
It is often only 50–70% of the total cost.
Example
A homeowner in Durbanville recently told us:
“We’ve cut back on usage, switched off everything we can, but the bill barely moved.”
When we reviewed the bill:
- Usage had dropped by 18%
- The total bill dropped by less than 8%
The reason becomes clear in the next sections.
2. Fixed Charges (You Pay These No Matter What)
These are the charges that apply whether you use electricity or not.
Common names include:
- Service Charge
- Basic Charge
- Connection Fee
What they mean:
- You are paying to be connected to the grid
- You are paying for availability, not usage
Even if your house is empty for a month, these charges still apply.
Simple way to understand it
You are paying:
- A membership fee to the grid
- Plus a usage fee on top
Most people only focus on the usage fee.
3. Network / Availability Charges (Where Costs Add Up Quietly)
This is one of the most important and least understood parts of a bill.
It may appear as:
- Network Charge
- Capacity Charge
- Availability Charge
What you are paying for:
- Grid infrastructure
- Maintenance of supply
- The ability to draw power when needed
Important point:
These charges are often linked to your property’s connection size or capacity, not just your usage.
Example
Two homes use the same amount of electricity:
- Home A: Small connection, standard setup
- Home B: Large home, higher capacity connection
Home B often pays more
Even though usage is the same
Client insight
“We thought our bill was high because of usage. Turns out, we were being charged for the size of the system we could use.”
4. Time-of-Use Tariffs (When You Use Power Matters)
Not all households are on this tariff, but if you are, it has a major impact.
Electricity pricing can vary by time:
- Peak – most expensive
- Standard
- Off-peak – cheapest
Typical household behaviour:
- Cooking dinner
- Running geysers
- Heating or cooling
- Lighting the home
All of this usually happens during peak hours.
Result
- You may not be using more electricity
- You are just using it at more expensive times
Real-world comment
“We thought our usage was the problem. It turned out we were just using power at the worst possible times.”
5. Taxes, Levies and Add-Ons
These are often listed as smaller line items:
- Environmental levies
- Regulatory charges
- Municipal surcharges
Each one looks minor on its own.
Combined, they can make a noticeable difference.
Because they are spread across multiple lines, most people overlook them.
Putting It All Together
Your bill is made up of two main parts:
1. What you use
- Measured in kWh
- The only part most people try to control
2. What you are charged regardless
- Fixed charges
- Network and availability costs
- Tariff structures
- Levies and add-ons
Case Breakdown (Typical High Residential Bill)
Example: ± R5,000 monthly bill
- 55–65% → Actual electricity usage
- 35–45% → Fixed, structural, and network-related costs
This is why reducing usage alone does not always solve the problem.
Why This Matters
Most people try to reduce their bill by:
- Using less electricity
- Switching off appliances
- Changing behaviour
That helps, but only addresses part of the problem.
The larger issue is:
You are operating inside a pricing structure you don’t control.
Where Solar Fits Into This
Solar does not just reduce consumption.
It changes your position within the system.
- You rely less on grid electricity
- You reduce exposure to tariff increases
- You avoid buying power during peak pricing
- You gain more predictable monthly costs
For many households, predictability becomes more valuable than just savings.
How to Review Your Own Bill
Take your latest bill and go through it line by line.
Ask:
- What portion is actual kWh usage?
- What portion is fixed or unavoidable?
- Are there network or availability charges?
- Are you on a time-of-use tariff?
If you can answer these, you already understand more than most.

Resources to Verify and Learn More (South Africa)
Regulatory and National
- NERSA (National Energy Regulator of South Africa)
https://www.nersa.org.za
Tariff approvals and pricing structures across the country - Eskom Tariff Documents
https://www.eskom.co.za
Direct access to residential tariff structures and pricing methodologies
Municipal Tariff Booklets
These are critical. Every municipality publishes them annually.
- City of Cape Town Electricity Tariffs
https://www.capetown.gov.za/Family%20and%20home/residential-utility-services/residential-electricity-services/electricity-tariffs - City of Johannesburg Tariffs
https://www.joburg.org.za/services_/Pages/City%20Services%20Overview/Revenue/tariffs.aspx - eThekwini Municipality Tariffs
https://www.durban.gov.za
These documents include:
- Fixed charges
- Usage tiers
- Network costs
- Time-of-use pricing
Industry and Energy Information
- SAPVIA (South African Photovoltaic Industry Association)
https://www.sapvia.co.za - GreenCape Energy Reports
https://www.greencape.co.za
These provide:
- Market insights
- Energy pricing trends
- Solar adoption data
Practical Tools
- Your municipality’s annual tariff booklet (PDF)
- Eskom tariff comparison tools
- Independent solar cost calculators
Final Thought
Your electricity bill is not just a number.
It is a system.
And once you understand how that system works, you move from reacting to it to making informed decisions around it.
Leave a Reply